
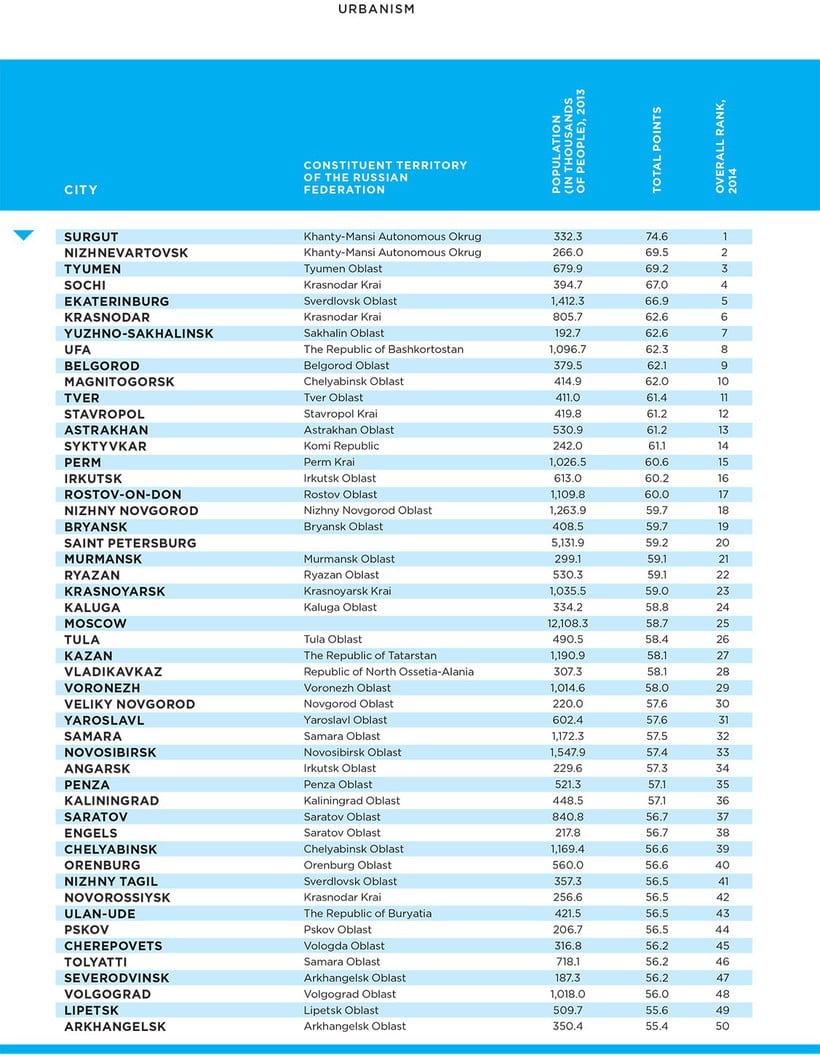
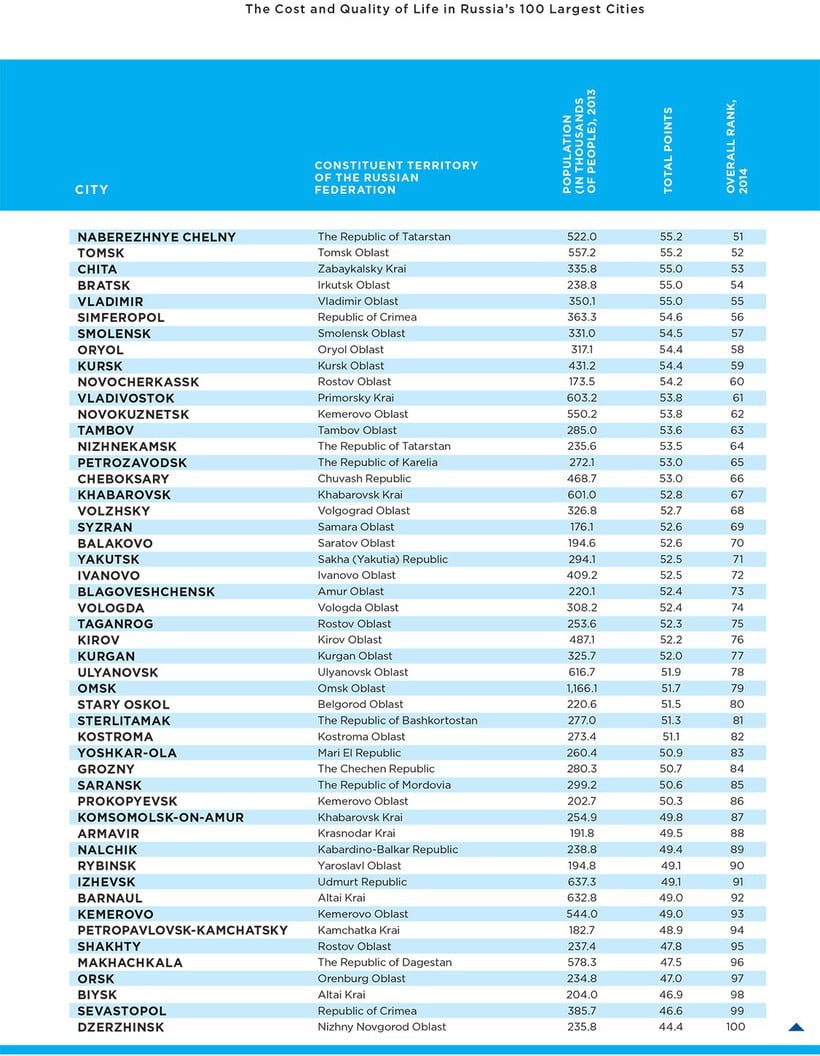
The Cost and Quality of Life in Russia’s 100 Largest Cities

The Urbanica Institute of Spatial Planning has regularly prepared an integral rating of the 100 largest Russian cities since 2011. The authors call it ‘a goal-setting tool,’ which is available to anyone who is interested in assessing the attractiveness of a certain city. For researchers and authorities, the conclusions about what motivates Russian people is also quite useful.
The purpose of these ratings is to identify which cities have an optimal balance of ‘cost’ and ‘quality’ of life. This is the first attempt to evaluate Russian cities as a kind of ‘product’ or ‘service’ that residents consume. In addition, the ratings allow a comparative evaluation of policies aimed at increasing a city’s attractiveness for its residents.
Most indicators used in these ratings are calculated based on the selection of approximately 25 statistical indicators, each of which is weighted according to its importance. City ranking data is published annually online and is separated out by 14 of these indicators, making it possible to better identify the ‘leading areas’ and ‘lagging areas’ for each participant.
The combined ratings indicators may be used as a tool for residents to set goals and assess the attractiveness of each city. They have several characteristics:
1. Comprehensiveness (integration) – the ratings include data describing all the basic needs of residents;
2. Representativeness – the ratings only consider the issues that are most relevant to the current inhabitants of a city (housing problems, security, transportation, cost of food, and utilities);
3. Objectivity – the ratings do not utilize expert opinions. Only publicly available statistics are used, including census data from the Russian Federation, real estate companies (regarding prices in the urban real estate market), and common assessments of climate and environmental conditions.
Analyzing the ratings, we can identify the main factors influencing the optimal ratio of cost to comfort of life in a city. For example, in most cases, the active involvement of a city in the redistribution of financial flows from raw material rents becomes vital to the wellbeing of its residents in terms of cost of living.
It is in the authorities’ interests to interpret the results as clearly as possible. Within the context of cost of living indicators, the competitiveness of a city still plays a very important role. For example, city authorities can recognize how overvalued or undervalued the housing market is compared to their neighbors. Qualitative indicators offer a chance to see deterioration or improvement, not only in the municipalities’ own statistics but also in comparison with the rise and fall of the same indicators in the 99 largest cities in the country. Of course, a municipality cannot directly influence, say, the vehicle-to-population ratio, but it could respond by improving the quality of public transportation
These ratings have been published for a few years, and now include active feedback from the municipalities, who ask questions about their respective positions to understand why they lag in certain areas. In past years, the bulk of these questions were related to the actual values, but at the 2014 ‘Strategists Forum’ presentation of the ratings, most of the questions and discussion were centered on the methodology, general rating criteria, and current statistical information available. Increasingly, there are more questions regarding what data city governments should collect to better understand their urban processes.
It is in the authorities’ interests to interpret the results as clearly as possible and draw the correct conclusions. Within the context of cost of living indicators, the competitiveness of a city still plays a very important role. For example, city authorities can recognize how overvalued or undervalued the housing market is compared to their neighbors.
Qualitative indicators offer a chance to see deterioration or improvement, not only in the municipalities’ own statistics but also in comparison with the rise and fall of the same indicators in the 99 largest cities in the country. Of course, a municipality cannot directly influence, say, the vehicle-to-population ratio, but it could respond by improving the quality of public transportation and the connectivity of various parts of the city.
The ratings show the motivations of the Russian urbanites as well. We can distinguish two groups of cities that are traditionally at the top of the ratings – they are multifunctional regional capitals and large industrial centers, primarily for the oil and gas, petrochemical, and metallurgical industries. Unfortunately, this means that today, in most cases, financial indicators are more indicative of living standards than are qualitative indicators.

Head of the Economic Analysis and Research Department at the Urbanica Institute of Spatial Planning